Cerved Analysis

The construction sector is the main driver of compulsory liquidations

Total transactions rose by 4.8 per cent in the first half of the year. Delays in the transport sector are worsening in business-to-business payments

 EPA

3' min read

Translated by AI
Versione italiana

3' min read

Translated by AI
Versione italiana

Almost 40 businesses a day, including Saturdays and Sundays. Figures compiled by Cerved on the initiation of insolvency proceedings in the first half of the year show an upward trend. Whilst court-ordered liquidations rose by 2.4% overall, other insolvency measures saw a more significant increase, with a 16.6% rise.

The total stands at 6,672 cases, an increase of 4.8 per cent compared with the same period in 2025. The largest share relates to judicial liquidations, which totalled 5,401. Here, the figures rose by 2.4 per cent, a significantly more modest increase compared with the 15.7 per cent rise in the first half of 2025. Other crisis resolution measures rose by 16.6 per cent to 1,271 cases, bringing their share to 19.0 per cent of the total under consideration.

Loading...

Among the individual categories, the number of preventive composition agreements rose by 24.6 per cent over the half-year, whilst protective and precautionary measures under the relevant procedure increased by 35.9 per cent; restructuring agreements, on the other hand, fell by 20 per cent over the half-year, despite a 21.1 per cent increase in the second quarter.

Looking at the figures by macro-sector, the growth in judicial liquidations varies from sector to sector. The Services sector accounts for 38.2 per cent of cases, followed by Construction (22.9 per cent) and Retail (22.7 per cent); the latter has risen by 7.1 per cent, whilst the Manufacturing sector has increased by 6.0 per cent.

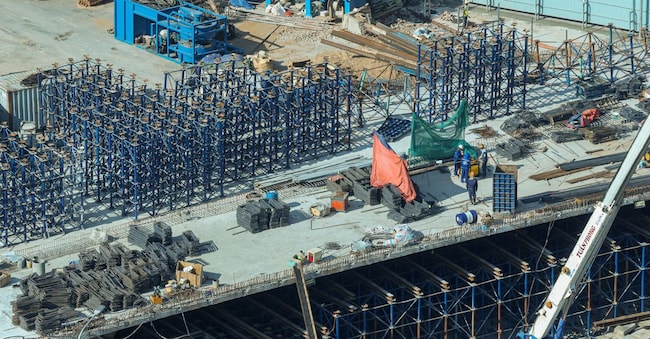
Among the individual sectors, the construction sector once again stands out, remaining in first place with 831 judicial liquidations, at similar levels to the first half of 2025. The construction sector is currently also bearing the brunt of sharp rises in raw material prices – additional costs that contracting authorities are struggling to recognise with the necessary speed – whilst the Ministry of Infrastructure is also significantly behind schedule in paying arrears relating to public contracts. The latest estimate from ANCE highlighted a shortfall of around 3.8 billion euros for the entire Italian construction sector.

Across the country, the North-West and Central regions account for 28.8 per cent and 28.2 per cent respectively of court-ordered liquidations, with Lombardy topping the list due to its higher absolute figures in terms of the number of companies. This region accounts for 22.2 per cent of the national total, ahead of Lazio (18.2 per cent) and Campania (10.3 per cent).

What is particularly worrying, however, is the demographic data, which shows a particularly sharp rise in insolvency proceedings amongst the youngest firms: for those up to five years old, the increase is close to 50 per cent.

Inter-company balances

As for insolvency proceedings, which are indeed on the rise, the figures are nonetheless lower than those recorded before the Covid-19 pandemic; there has also been a slight improvement in payment data, indicating that the system is essentially holding up. Cerved’s Payline database shows shorter payment times compared with the same quarter of 2025 across all company size categories, with the most marked improvement among medium-sized enterprises: 61.31 days compared with 62.72, whilst large enterprises have seen a reduction from 72.35 to 71.57 days. The relationship between company size and overall payment times remains structural: these increase as one moves from micro-enterprises to large enterprises.

However, a closer look at the figures puts this positive trend into perspective. It should be borne in mind that the overall improvement stems largely from a reduction in the number of days agreed under contract. As regards punctuality, micro and small enterprises have in fact reduced their delays by 0.47 and 0.20 days respectively compared with the second quarter of 2025, whilst medium-sized and large enterprises have increased theirs by approximately 0.49 and 0.25 days.

The pressure on fuel prices and the additional costs that businesses are forced to bear are among the possible explanations for the sector-wide trend, which shows the greatest increases in delays precisely amongst transport vehicles. Here, the delay has risen from 10.6 to 12.2 days – the largest increase among the sectors analysed.

Loading...

The Fashion sector, FMCG, Chemicals and Pharmaceuticals, Intermediate Goods and Property are also seeing their performance deteriorate. Agriculture remains at high levels, at 12.6 days, but has improved compared with the 12.9 days recorded in 2025.

Across the country, the North-East has the shortest delay, limited to just 6 days compared with the agreed times, whilst in the South and the Islands the delay is more than double that, averaging over 13 days. Among the regions, Sicily stands out with 17 days, followed by Sardinia and Calabria, both exceeding 14 days.

Copyright reserved ©
Loading...

Brand connect

Loading...

Newsletter

Notizie e approfondimenti sugli avvenimenti politici, economici e finanziari.

Iscriviti