Letter to savers

Royal Caribbean to offer more luxury cruises and make use of big data

Compared with its competitors, the airline focuses more on the premium segment. However, it is less diversified in terms of routes and the nationalities of its passengers

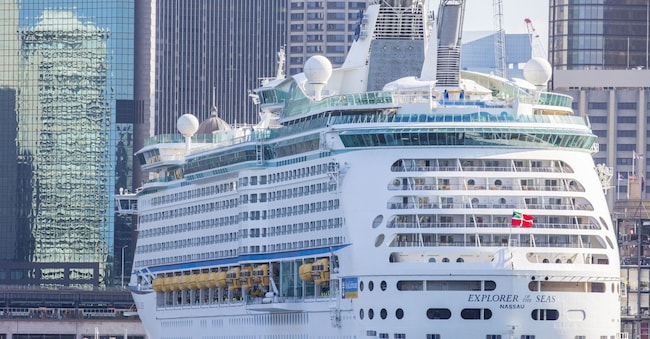
Royal Caribbean MS Explorer of the Seas  Loop Images Ltd. / AGF

6' min read

Translated by AI
Versione italiana

6' min read

Translated by AI
Versione italiana

Which stocks have been the standout performers on the stock market over the last 12 months? For the most part, for better or worse, the usual tech stocks and – unfortunately – those in the defence and military sectors.

The Stock Exchange

On closer inspection, however, there is another sector that has also performed well: cruises. In particular, Royal Caribbean Cruises has maintained a remarkable pace. According to Seeking Alpha, the US group has risen by 78.8 per cent over the past year. This figure is significant because, over the same period, the Nasdaq rose by only 23.6 per cent. One might argue that extending the period under review would change the picture. This is not the case: the trend remains the same. Looking at the last two years, Royal Caribbean’s share price has risen by over 250 per cent, whilst the tech index has seen an increase of just 69 per cent. What’s more: from 2021 to the present day (a five-year period), the ‘cruise line’ company has risen by 394.6 per cent on the stock market, compared with a 102 per cent rise in the Nasdaq. Of course, individual tech companies, such as chip giant Nvidia, outperform Royal Caribbean on the stock market – and by a considerable margin. However, the underlying point remains valid: the group has performed well on the market.

Loading...

Economic trends

Yes, that’s right. But what are the reasons behind this trend? One key factor was the improvement in the company’s financial results. The company – like the rest of the sector – suffered a collapse in the wake of the Covid-19 pandemic. The suspension of cruises sent its financial figures plummeting. According to the Bloomberg terminal, in 2020 and 2021, adjusted revenues fell to $2.2 billion and $1.5 billion respectively. At the same time, the bottom line was marked by losses of $4 billion and $4.9 billion. In 2022, however, the recovery began. Turnover – driven by the resumption of cruises – rose to $8.8 billion, whilst adjusted profitability remained in the red (-$1.9 billion). The situation turned around completely in the following financial year (2023). In that year, Royal Caribbean posted an adjusted profit of 1.8 billion dollars. Then, in 2024, turnover reached 16.48 billion and adjusted net profit stood at 3.24 billion.

SEMESTRI A CONFRONTO

Loading...

First half of 2025

On closer inspection, the trend continued into 2025. In the first half of the financial year, revenue stood at $8.54 billion (compared with $7.8 billion twelve months earlier) and net profit rose to $1.9 billion, compared with $1.2 billion recorded in the first half of 2024. In particular, with regard to turnover, a boost came from ticket sales, which accounted for almost two-thirds of turnover (69.6 per cent of the total). This figure grew by 9.4 per cent, rising from $5.4 billion in 2024 to $5.9 billion (2025).

This surge is the result of two factors. On the one hand, there is an increase of 274 million linked to the so-called ‘yield’. That is to say: the average revenue per passenger per day of cruising, which depends on both price levels and cabin occupancy rates. On the other hand, the growth (+4.4 per cent) in fleet capacity (more passengers carried) is significant, thanks to the addition of the ships ‘Utopia of the Seas’ and ‘Silver Ray’ to the fleet. The remaining 30.4 per cent of turnover, for its part, relates to on-board activities (plus other revenue). The latter totalled 2.6 billion, up 7.7 per cent compared with the same period last year. Here too, this trend was driven by both increased capacity (+106 million) and improved profitability (+79 million). This combination resulted from higher passenger numbers and higher prices.

PASSEGGERI PER AREA GEOGRAFICA

Loading...

Against this backdrop, Royal Caribbean was nevertheless able to keep operating costs under control. These stood at 4.36 billion, compared with 4.2 billion a year earlier. Consequently, the EBIT margin increased. In the first half of 2024, it had stood at around 23.6 per cent, whilst at the end of last June the figure stood at 26.6 per cent. Clearly, in the wake of such figures, the market – despite its ups and downs – has rewarded the share price. This is also because the US cruise group – again following the publication of its second-quarter 2025 results – has revised its guidance for the full financial year upwards. In April, adjusted earnings per share were forecast to be between $14.55 and $15.55. Adjusted EPS is now expected to settle within the range of $15.41 to $15.55.

RICAVI E AREE GEOGRAFICHE

Loading...

Strategies

So far, we have looked at some considerations regarding stock market dynamics and the profit and loss account. But what, then, are the key strategies for sustaining the business? One key lever is undoubtedly the company’s stronger positioning – compared, for example, to its rival Carnival Corporation – in the premium and luxury segments. Royal Caribbean International (a brand within the group) dominates the mainstream market, but the group’s strength also lies in Celebrity Cruises, a premium brand, and in Silversea, which specialises in pure luxury and adventure travel. This structure generates higher yields and superior margins. The ship pipeline, moreover, confirms this strategy: the ‘Star of the Seas’, the second Icon-class vessel, and new ships such as the ‘Celebrity’ aim to transform the ship into a destination in its own right, with larger suites, themed attractions and premium-priced services. This model is less diversified than that of Carnival itself, which, through Costa, Aida and P&O, covers more entry-level markets. Royal Caribbean, on the other hand, is more focused on the high end of the market. This increases pricing power, but on the one hand exposes the company to a greater risk of a potential slowdown in demand; and, on the other, makes it potentially more difficult to capitalise on the fact that cruise passengers often wish to try a more expensive cruise after their first trip.

Private destinations

However, it is not just about ships and luxury. The group is focusing – much like its competitors – on exclusive destinations. CocoCay has proven to increase average spending, and the model will be replicated with the Royal Beach Clubs on Paradise Island (2025) and in Cozumel (2026). Controlling the port of call means maximising revenue and differentiating the offering. This offering is then tailored, in part, through the use of digital technology and big data. Here, for example, on the one hand, online platforms and on-board apps facilitate pre-departure sales of dining packages, excursions and services. On the other hand, analysing customer data provides a better understanding of how demand is evolving.

Debt

So, is it all as easy as sunbathing on the beach? The reality is more complex. The first aspect to bear in mind is the financial structure. Like all companies in the sector, following the Covid-19 pandemic – when debt inevitably soared – the group embarked on a process of deleveraging. According to the Bloomberg terminal, total debt stood at 11.7 billion in 2019. By 2022, it had jumped to 23.9 billion. From that point onwards, the company has made a significant effort to reduce its debt position. At the end of the last quarter, ‘total debt’ stood at 19.5 billion dollars (20.6 at the end of 2024). Similarly, the ‘net debt to EBITDA ratio’ has gradually fallen. According to ValueSense, the 12-month rolling ratio as at 30 June stood at 3 times. On the one hand, this figure is – as the company indicates – below the debt covenants; on the other hand, however, it remains high. Consequently, the DIY investor must monitor developments in the financial structure.

That is not all. Royal Caribbean is not particularly diversified in terms of either its routes or the origin of its customers. With regard to the former, in the last quarter, 62.2 per cent of revenue was generated by North American and Caribbean itineraries. As for the second point – again in the second quarter of 2025 – revenue from US passengers accounted for 76 per cent of the total. Now, such a marked concentration means high margins when the US market is growing, not least because American customers spend more and are more inclined to opt for premium services. At the same time, however, exposure to specific risks increases: weather events in the Gulf of Mexico, geopolitical tensions or economic slowdowns in the US can have a direct and disproportionate impact on results. These are situations that the DIY investor would do well to bear in mind at all times.

Loading...

SCADENZE ANNUALI DEL DEBITO

Loading...

Reviews

That said, what are the company’s stock market multiples? According to Seeking Alpha, the forward non-GAAP price-to-earnings ratio stands at 20.88 times. In other words, this is not a low figure when compared with the relevant sector. The forward non-GAAP PEG ratio, on the other hand, stands at 0.92. This is below the median for the sector. Beyond that, according to Seeking Alpha: ‘Royal Caribbean’s valuation is stretched. For example, the price-to-revenue ratio stands at 5.65, which is higher than the sector median (...). The price-to-book ratio is also significantly high at 10.76’. In short: DIY investors will, as always, need to proceed with caution.

Copyright reserved ©
Loading...

Brand connect

Loading...

Newsletter

Notizie e approfondimenti sugli avvenimenti politici, economici e finanziari.

Iscriviti